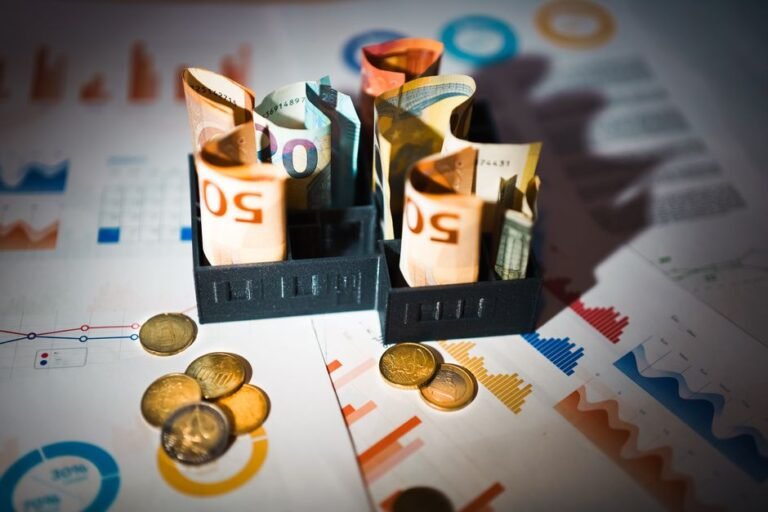
Total Expense Ratio ETF Europe: The Fee That Eats Your Returns Quietly
total expense ratio ETF Europe — Expert-Backed Solutions for Complete Peace of Mind
Let’s get something out of the way.
“If you’re investing in European ETFs and you haven’t looked at the total expense ratio, you’re flying blind.”
Not in a dramatic way. In the quiet, slow, barely noticeable way that costs you real money over a decade or two. The total expense ratio ETF Europe investors encounter varies wildly, and most people have no idea what they’re Actually paying.
Here’s the thing about expense ratios. They don’t show up on your statement as a separate charge. Nobody sends you an invoice. The fee is deducted directly from the fund’s assets, which means your returns are already net of costs before you ever see a number. You could be paying 0.03% or 0.75% and the difference wouldn’t jump out at you on any given day. But compound that over twenty years, and you’re looking at a gap that could fund a year of retirement.
So what exactly is the total expense ratio? It’s the annual fee that an ETF charges to cover its operating costs. Management fees, administrative expenses, legal costs, audit fees, marketing in some cases. Everything gets bundled into one percentage, expressed as a yearly figure. If a fund has a TER of 0.20%, that means for every 10,000 euros you have invested, you’re paying 20 euros per year. Sounds small. It is small. Until it isn’t.
The total expense ratio ETF Europe investors face depends on several factors. The provider matters. The asset class matters. The fund size matters. And honestly, the country where the fund is domiciled matters more than most people realize.
Why European ETF Fees Look the Way They Do – total expense ratio ETF Europe
Download our exclusive step-by-step guide on total expense ratio ETF Europe.
Europe’s ETF market is a patchwork. Unlike the US, where a handful of providers dominate and competition has driven fees to near zero on broad index funds, Europe still has meaningful variation. You’ve got iShares (BlackRock), Vanguard, Xtrackers (DWS), Amundi, Lyxor (now part of Amundi), SPDR (State Street), and a growing number of smaller players like Tabula and Carbon Collective.
The total expense ratio ETF Europe funds charge tends to be higher than their US counterparts. There’s no single reason for this. Part of it is that European ETFs are often smaller in assets under management, so the fixed costs get spread across fewer investors. Part of it is regulatory complexity. Europe doesn’t have a single securities regulator the way the US has the SEC. You’ve got ESMA at the EU level, but each country has its own financial authority, its own tax rules, its own distribution requirements. That adds cost.
And part of it is simply that European investors have been slower to demand lower fees. The US ETF market went through a brutal fee war starting around 2013. Vanguard entered the market aggressively, Schwab undercut everyone, and iShares had to respond. That same pressure has been slower to build in Europe, though it’s definitely happening now.
Let’s talk numbers. A broad European equity ETF from iShares, like the Core MSCI Europe UCITS ETF, charges around 0.12% TER. Vanguard’s FTSE Developed Europe UCITS ETF comes in at 0.10%. Xtrackers offers similar exposure at 0.06% on some of its funds. That’s the competitive end of the spectrum.
But go into more niche territory and the numbers jump. A European small-cap ETF might charge 0.30% or more. A thematic fund focused on something like European clean energy could charge 0.45% or higher. Emerging Europe exposure? You might see 0.60% or above. The total expense ratio ETF Europe investors pay for specialized exposure can be three to five times what they’d pay for a plain vanilla broad market fund.
“A 0.50% difference in expense ratio doesn’t sound like much until you realize it can cost you over 10% of your total returns over 25 years. The math is brutal and silent.”
The Domicile Problem Nobody Talks About – total expense ratio ETF Europe
Here’s where it gets complicated. European ETFs are typically domiciled in Ireland or Luxembourg. These two countries have become the go-to jurisdictions for UCITS funds, which is the regulatory framework that allows ETFs to be sold across the EU. Ireland and Luxembourg both offer favorable tax treatment and well-established fund administration infrastructure.
But domiciliation affects your total expense ratio in ways that aren’t always obvious. Irish-domiciled funds are subject to a 25% withholding tax on US dividends at the fund level, before the money ever reaches you. Luxembourg-domiciled funds face the same issue. This isn’t technically part of the TER, but it’s a cost that reduces your returns. Some funds use securities lending revenue to offset this drag, and that’s worth looking into.
The total expense ratio ETF Europe investors see listed on a factsheet doesn’t capture this tax drag. It’s a separate thing. So when you’re comparing two funds with identical TERs but different domiciliation strategies, one might actually be cheaper in practice. This is one of those details that separates people who think about costs from people who just glance at the headline number.
There’s also the question of accumulating versus distributing funds. In some European countries, accumulating funds are more tax-efficient because you defer capital gains. In others, the treatment is different. Germany, for example, has a complicated system called the Vorabpausale that applies a deemed distribution tax even on accumulating funds. The Netherlands has its own wealth tax framework. France has the flat tax. None of this changes the TER directly, but it changes what you actually keep.
How to Actually Compare Total Expense Ratio Across European ETFs
Comparing TERs sounds straightforward. You look at two funds, see which number is lower, and pick the cheaper one. But it’s not that simple, and anyone who tells you it is hasn’t spent enough time looking at this.
First, make sure you’re comparing like for like. A total expense ratio ETF Europe fund tracking the MSCI Europe Index isn’t the same as one tracking the STOXX Europe 600, even though they sound similar. The underlying index methodology affects tracking difference, which is a separate cost from the TER. Tracking difference measures how closely the fund follows its index, and a fund with a low TER but poor tracking difference can actually be more expensive in practice than a fund with a slightly higher TER that tracks its index tightly.
Second, look at the fund’s total cost of ownership. This includes the TER plus the bid-ask spread you pay when buying and selling, plus any brokerage commissions, plus the tax drag from domiciliation. Some brokers in Europe charge per-trade fees that can eat into your returns if you’re investing regularly. Others offer free trading on certain ETFs. Interactive Brokers, for example, has a different fee structure than Trade Republic or Scalable Capital or DEGIRO. The total expense ratio ETF Europe investors focus on is just one piece of the puzzle.
Third, check whether the fund engages in securities lending. Many large ETFs lend out a portion of their holdings to short sellers and earn revenue from doing so. This revenue can offset some of the fund’s expenses, effectively reducing the net cost to investors. iShares and Vanguard both do this, but the extent varies by fund. The TER listed on the factsheet is the gross figure. The net cost to you might be lower.
The Biggest Mistake People Make With ETF Fees in Europe
Most investors fixate on the TER and ignore everything else. I get it. It’s the most visible number. It’s the one that gets compared in articles and on comparison websites. But focusing solely on the total expense ratio ETF Europe funds charge is like buying a car based only on fuel efficiency and ignoring insurance, maintenance, and depreciation.
Tracking difference is arguably more important than TER for many funds. A fund with a 0.10% TER and a tracking difference of -0.30% is costing you 0.40% in total. A fund with a 0.20% TER and a tracking difference of -0.05% is costing you 0.25%. The cheaper TER fund is actually more expensive.
This happens because of how the fund handles things like dividend reinvestment, withholding tax recovery, and cash drag. Some funds are better at this than others. Vanguard, for example, has historically had excellent tracking difference on its European funds. Some smaller providers don’t.
Another mistake is ignoring the impact of fund size. Larger funds tend to have lower TERs because fixed costs are spread across more assets. They also tend to have tighter bid-ask spreads because there’s more liquidity. The iShares Core MSCI World UCITS ETF has over 50 billion euros in assets. Its TER is 0.20%, and the bid-ask spread is razor-thin. A smaller thematic ETF with 200 million in assets might have a TER of 0.45% and a spread that costs you 0.10% every time you trade. The total expense ratio ETF Europe investors see on the factsheet doesn’t tell you about liquidity costs.
What the Major Providers Actually Charge
Let’s break down what the big players charge for European equity exposure. This isn’t exhaustive, but it gives you a sense of the landscape.
iShares is the largest ETF provider in Europe by assets. Their Core range is their low-cost line. The iShares Core MSCI Europe UCITS ETF charges 0.12% TER. The iShares Core MSCI World UCITS ETF charges 0.20%. The iShares Core S&P 500 UCITS ETF charges 0.07%. These are competitive, though not always the cheapest.
Vanguard has been expanding its European ETF range aggressively. Their FTSE Developed Europe UCITS ETF charges 0.10%. Their FTSE All-World UCITS ETF charges 0.22%. Vanguard’s philosophy is to charge low fees and pass economies of scale to investors. They’re structured as a mutual ownership structure, which means the fund effectively owns itself. There’s no external shareholder taking a profit.
Xtrackers, which is DWS’s ETF brand, often undercuts both iShares and Vanguard on specific funds. Their MSCI World UCITS ETF charges 0.19%. Their FTSE Developed Europe UCITS ETF charges 0.06%, which is among the cheapest available. Xtrackers has been quietly building a reputation for low fees, though their fund range isn’t as broad as iShares.
Amundi, which absorbed Lyxor, is another major player. Their fees tend to be slightly higher than iShares and Vanguard on comparable funds, but they have strong offerings in fixed income and ESG. The Amundi MSCI Europe UCITS ETF charges around 0.12%, but some of their more specialized products go up to 0.40% or higher.
SPDR, State Street’s brand, has some of the oldest ETFs in Europe. Their fees are generally competitive but not always the lowest. The SPDR MSCI World UCITS ETF charges 0.12%, which is reasonable.
Here’s a comparison table to put some of this in perspective.
| Provider | Fund | Index | TER | Fund Size (EUR) | Domicile |
|---|---|---|---|---|---|
| iShares | Core MSCI Europe | MSCI Europe | 0.12% | ~15 billion | Ireland |
| Vanguard | FTSE Developed Europe | FTSE Developed Europe | 0.10% | ~8 billion | Ireland |
| Xtrackers | FTSE Developed Europe | FTSE Developed Europe | 0.06% | ~3 billion | Luxembourg |
| Amundi | MSCI Europe | MSCI Europe | 0.12% | ~5 billion | France |
| SPDR | MSCI Europe | MSCI Europe | 0.12% | ~4 billion | Ireland |
Notice that Xtrackers is the cheapest at 0.06%, but the fund is smaller. That doesn’t necessarily mean it’s riskier, but it’s worth considering. A smaller fund could face liquidity issues or even closure if assets drop too low. It’s rare, but it happens.
Where Fees Are Heading in the European ETF Market
The trend is clearly downward. The total expense ratio ETF Europe investors pay has been falling steadily for the past decade, and there’s no sign of it stopping. New entrants are putting pressure on incumbents. Tabula, for example, launched a range of European fixed income ETFs with TERs that undercut established players. Carbon Collective offers thematic ESG funds at competitive rates.
But here’s my honest take. We’re approaching the point of diminishing returns on fee compression for broad market equity funds. When the TER is 0.06% versus 0.12%, the difference on a 10,000 euro investment is 6 euros per year. That’s not nothing, but it’s not going to change your life. The bigger wins come from asset allocation, tax efficiency, and behavioral discipline. I’d rather someone pay 0.12% in a fund they understand and will hold for twenty years than chase a 0.06% fund they’ll abandon after a bad quarter.
That said, for fixed income ETFs, fees matter more. Bond returns are lower than equity returns, so a 0.20% TER on a bond fund takes a bigger bite proportionally. If you’re earning 3% on a European government bond ETF and paying 0.20% in fees, that’s nearly 7% of your return gone. On an equity fund returning 8%, the same 0.20% is only 2.5% of your return. The total expense ratio ETF Europe investors pay on fixed income deserves more scrutiny than it usually gets.
The Hidden Costs That Aren’t in the TER
The TER doesn’t include everything. Transaction costs within the fund, like brokerage fees when the fund buys and sells securities, are generally not included in the TER. These can be significant for funds that track indices with high turnover or that hold less liquid securities.
Swing pricing is another mechanism that can affect your costs. When a fund experiences large inflows or outflows, the transaction costs of buying or selling underlying securities can be passed to the investors causing the flow. This isn’t captured in the TER either.
Then there’s the cost of your Broker. Some European brokers charge custody fees, inactivity fees, or currency conversion fees if you’re buying ETFs denominated in a currency different from your base currency. If you’re a German investor buying a dollar-denominated ETF, you might pay a conversion fee that dwarfs the TER. Interactive Brokers charges minimal conversion fees. Some traditional banks charge 1% or more. That’s not the ETF’s fault, but it’s part of your total cost.
The total expense ratio ETF Europe investors obsess over is just the starting point. The real question is: what’s the total cost of owning this fund, including everything?
What About ESG and Thematic ETFs?
ESG ETFs in Europe tend to charge higher TERs than their conventional counterparts. This makes some sense. ESG screening requires additional research and data. But the gap has been narrowing, and some ESG funds are now priced competitively with conventional funds.
The iShares MSCI Europe SRI UCITS ETF charges around 0.20%, compared to 0.12% for the standard MSCI Europe fund. That’s a meaningful premium. Whether it’s worth it depends on your values and your assessment of whether ESG screening actually changes outcomes. There’s genuine debate about that, and I won’t pretend there’s a consensus.
Thematic ETFs are where fees get painful. A European thematic fund focused on artificial intelligence or clean energy might charge 0.45% to 0.65%. These funds often have higher turnover because the theme evolves, and they hold smaller, less liquid companies. The total expense ratio ETF Europe investors pay for thematic exposure is hard to justify unless you have strong conviction and a long time horizon.
I’ll say something that might be unpopular. Most thematic ETFs are marketing products, not investment products. They’re designed to capture your attention and your money during a trend. By the time a thematic ETF launches, the trend is often partially priced in. You’re better off with a low-cost broad market fund and the discipline to hold it. But I know that’s not exciting, and excitement sells.
“The best ETF is the one you can hold for 20 years without checking the price. Low fees help. Boring helps more.”
Practical Steps to Minimize What You Pay
Start by identifying what you actually need. If you want broad European equity exposure, you don’t need to pay more than 0.12% TER. You can get it for 0.06% if you’re willing to use Xtrackers. That’s your baseline.
Next, check the tracking difference. Look at the fund’s factsheet or use a tool like justETF.com, which tracks this data. A fund with a consistently negative tracking difference is costing you more than the TER suggests.
Then, evaluate your Broker. If you’re paying per-trade fees and investing monthly, those fees add up. Look for brokers that offer free or low-cost trading on the ETFs you want. In Germany, Scalable Capital and Trade Republic offer free savings plans on many ETFs. In the Netherlands, Interactive Brokers is popular. In France, Boursorama has competitive offerings. The total expense ratio ETF Europe investors focus on means nothing if your broker is charging you 5 euros per trade.
Consider tax efficiency. If you’re in a country with favorable treatment of accumulating funds, make sure you’re using accumulating funds. If your country taxes deemed distributions, factor that into your decision. The TER is the same whether a fund accumulates or distributes, but your after-tax return can be very different.
Finally, resist the urge to optimize constantly. Switching between funds to save 0.03% in TER usually isn’t worth the transaction costs, the tax implications, or the mental energy. Pick a low-cost fund from a reputable provider and move on with your life. The total expense ratio ETF Europe investors should care about is the one that keeps you invested, not the one that keeps you tinkering.
FAQ
What is a good total expense ratio for European ETFs? – total expense ratio ETF Europe
For broad market equity ETFs, anything at or below 0.20% is reasonable. The cheapest options are around 0.06% to 0.10%. For bond ETFs, you want to stay below 0.20% because bond returns are lower and fees take a bigger proportional bite. Thematic and ESG funds often charge more, sometimes 0.40% or higher, and you should question whether the premium is justified.
Is the total expense ratio the only fee I pay when buying ETFs? – total expense ratio ETF Europe
No. The TER is the annual management fee deducted from the fund’s assets. You also face the bid-ask spread when buying and selling, brokerage commissions, potential currency conversion fees, and tax drag from the fund’s domiciliation. All of these add up, and the TER is just one component of your total cost.
Why are European ETF fees higher than US ETF fees?
Several reasons. European ETFs tend to be smaller in assets under management, so fixed costs are spread across fewer investors. Regulatory complexity across multiple EU countries adds cost. And the fee compression that happened in the US ETF market starting around 2013 has been slower to reach Europe, though it’s definitely happening now.
Should I always pick the ETF with the lowest TER?
Not always. A low TER is important, but you should also consider tracking difference, fund size, liquidity, and tax efficiency. A fund with a slightly higher TER but better tracking difference and tighter bid-ask spreads might actually be cheaper in practice. The total expense ratio ETF Europe investors see on a factsheet is a starting point, not the whole picture.
How do I find the TER of a European ETF?
The TER is listed on the fund’s factsheet, which is available on the provider’s website. It’s also shown on most ETF comparison platforms like justETF.com, Trackinsight, and Morningstar. Look for the “ongoing charge” or “total expense ratio” figure. Make sure you’re looking at the correct share class if the fund offers multiple versions.
Do accumulating ETFs have a different TER than distributing ETFs?
Usually not. The TER is typically the same for both share classes of the same fund. The difference is in how dividends are handled. Accumulating funds reinvest dividends internally, while distributing funds pay them out to you. The tax treatment differs by country, which affects your after-tax return, but the TER itself is generally identical.
Sources
Conclusion
The total expense ratio ETF Europe investors pay matters, but not in the way most articles suggest. It’s not about finding the absolute cheapest fund. It’s about understanding the full picture of what you’re paying and making informed decisions.
Here’s what I’d actually do if I were starting from scratch. Pick a broad market European equity ETF with a TER at or below 0.12%. Make sure the tracking difference is consistently close to zero. Choose an accumulating share class if your country’s tax system favors it. Use a broker with low or no trading fees. Set up a regular investment plan so you’re not trying to time the market. Then stop looking at it.
The total expense ratio ETF Europe investors obsess over is a means to an end. The end is building wealth over decades. Fees are one variable in that equation, and an important one, but not the only one. Asset allocation, tax efficiency, and your own behavior will matter more over a twenty-year horizon than whether you paid 0.06% or 0.12%.
That said, don’t be lazy about it. Check the numbers. Compare funds. Understand what you’re buying. Just don’t let the pursuit of the perfect fund prevent you from investing at all. A good fund you buy today is better than a perfect fund you never get around to buying.